Use this free Bar Chart Infographic for PowerPoint and Google Slides to communicate your data in a more engaging and informative manner.
Bar charts are very popular data visualization types because they are easy to understand and provide a clear picture for the comparison of data results. Business and marketing professionals can use the Bar Chart Infographic in their presentations in multiple ways. It can be utilized to illustrate and make comparisons between three numbers, percentages, or quantitative results. It is suitable for communicating sales patterns, employee performance, business results, financial flow, and more. You can also leverage it to illustrate growth and progress in your company. Showcase your data and information in a visually attractive way with the help of this colorful Bar Chart Infographic.
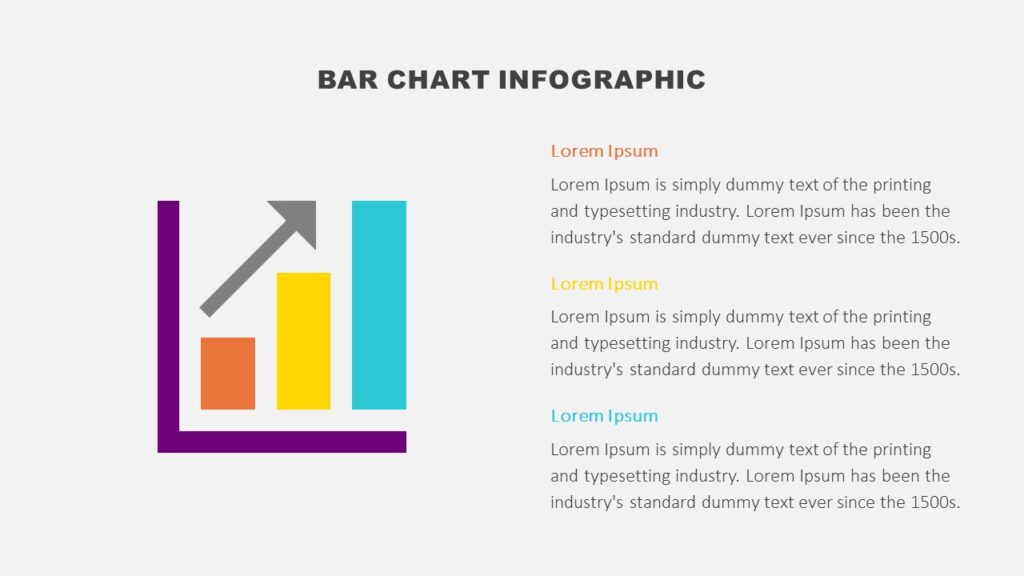
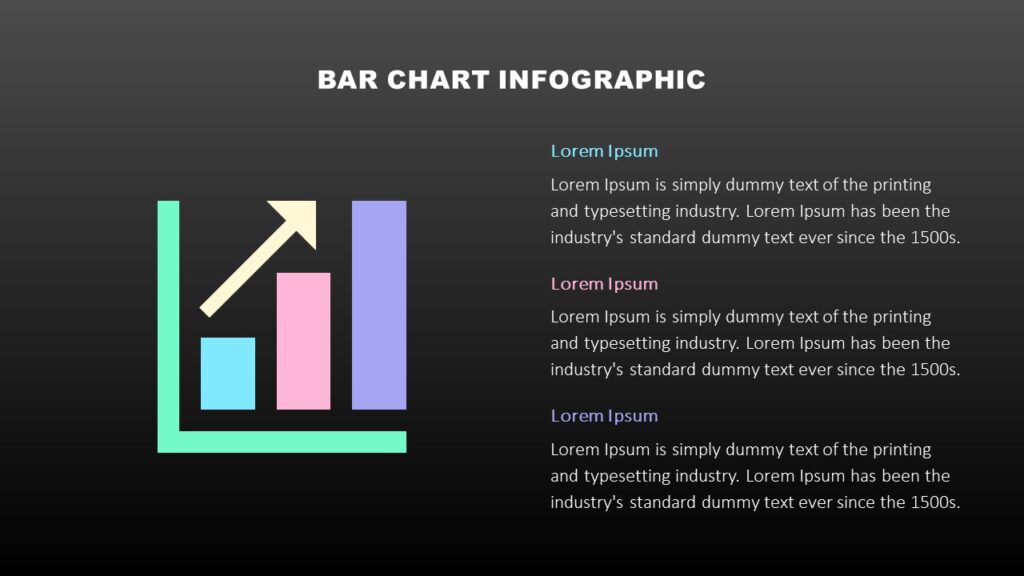
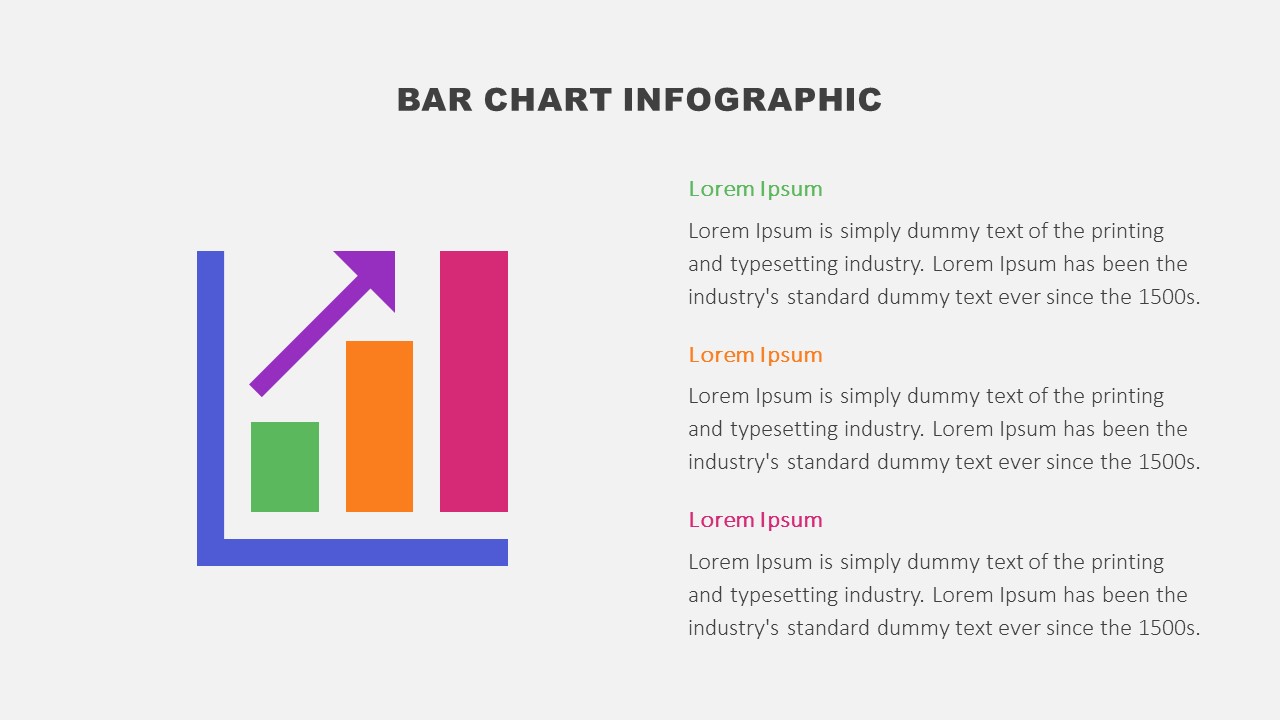
The Bar Chart Infographic for PowerPoint and Google Slides illustrates a multicolor vertical bar chart with an upward-going arrow (representing growth). Each bar has a different color to clearly compare quantitative results. You can also include the actual number or percentage inside each bar. Besides, a text placeholder accompanies each bar, which you can use to explain your data.
This ready-to-use template has three slides, with each slide featuring the Bar Chart Infographic in a different color combination. The slides are fully editable so you can choose the best ways to visually display your data and text. You can customize anything in the template from the color of the bars to the size of the fonts.
The top features of the Bar Chart Infographic for PowerPoint and Google Slides are:
- Fully and easily editable slides. The shapes and text in the slides are 100% editable.
- Selection of three different color schemes. In addition, modify the colors in the template as per your desire.
- Two background color versions available. Whether you prefer your presentation background light or dark, the template includes a slide in either version.
- This pre-made template works with Microsoft PowerPoint and Google Slides.
- 16:9 widescreen format. You can easily change the format to 4:3, just make sure to later fix any changes that may happen to the elements of the slides.
- Free fonts used: Arial Black, Calibri Light. Remember, you can also use the fonts that represent your brand.