Use this free Doughnut Chart Infographic for PowerPoint and Google Slides to present your information circularly.
You can represent various concepts such as cyclical processes, business models, workflows, and project lifecycle with this beautifully designed infographic. It is a perfect visual tool to display the continuing sequence of business events, steps, stages, or tasks that are repeated in a circular flow. You can also utilize it to showcase a timeline, a sequence of any actions or events, as well as explain planning topics and ideas. Additionally, the infographic can be useful to depict components or functions of a product, service, or any concept.
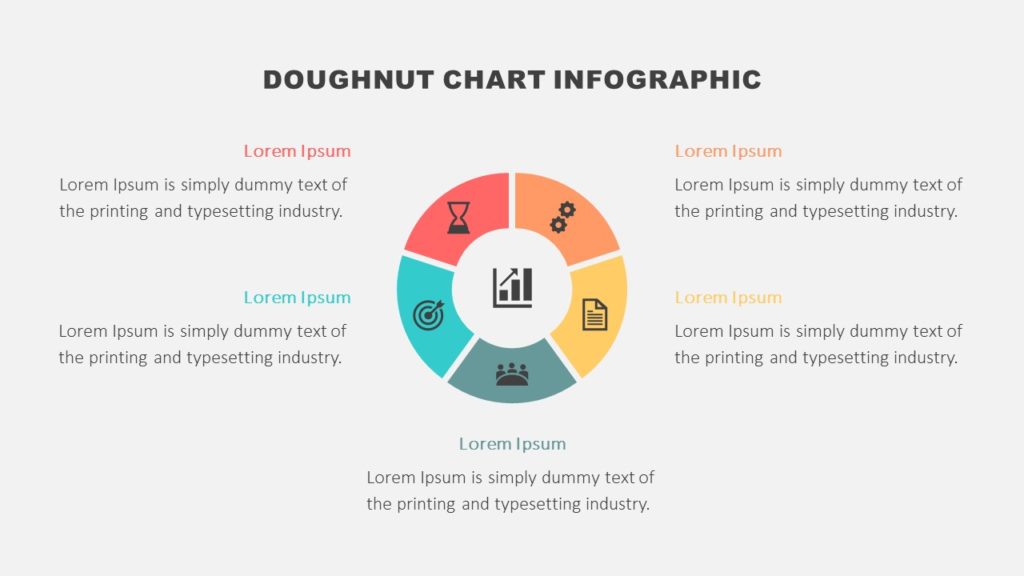
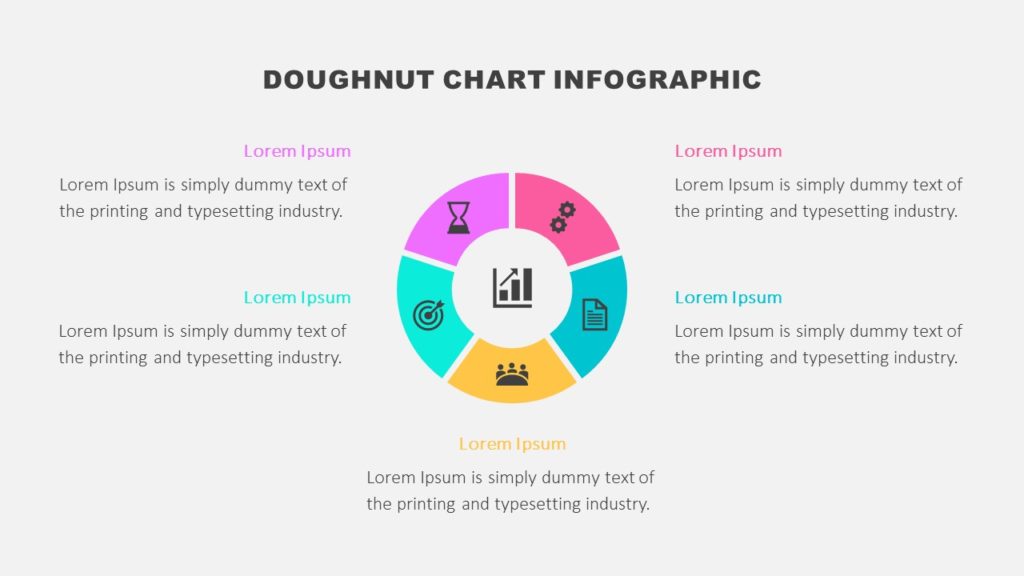
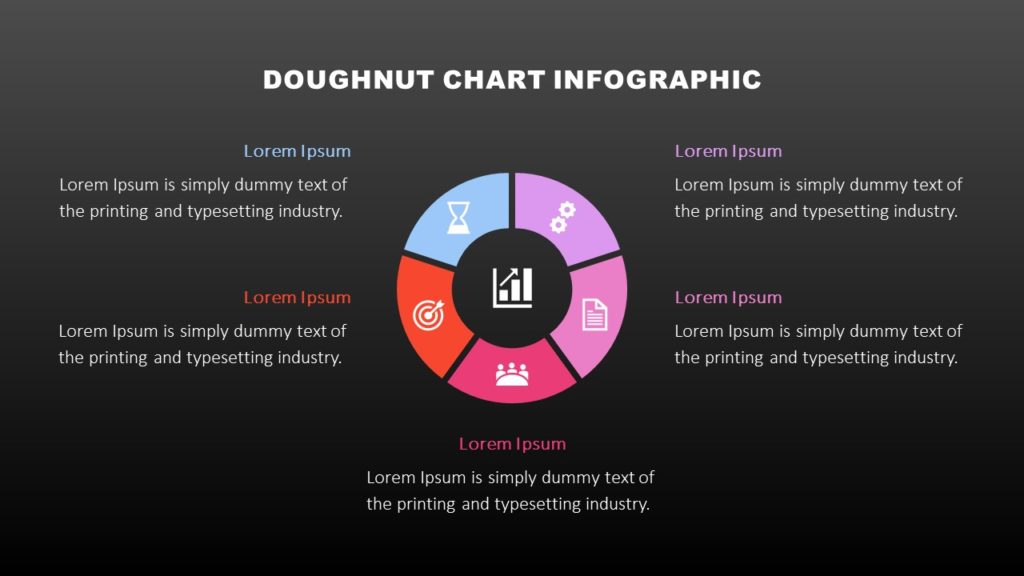
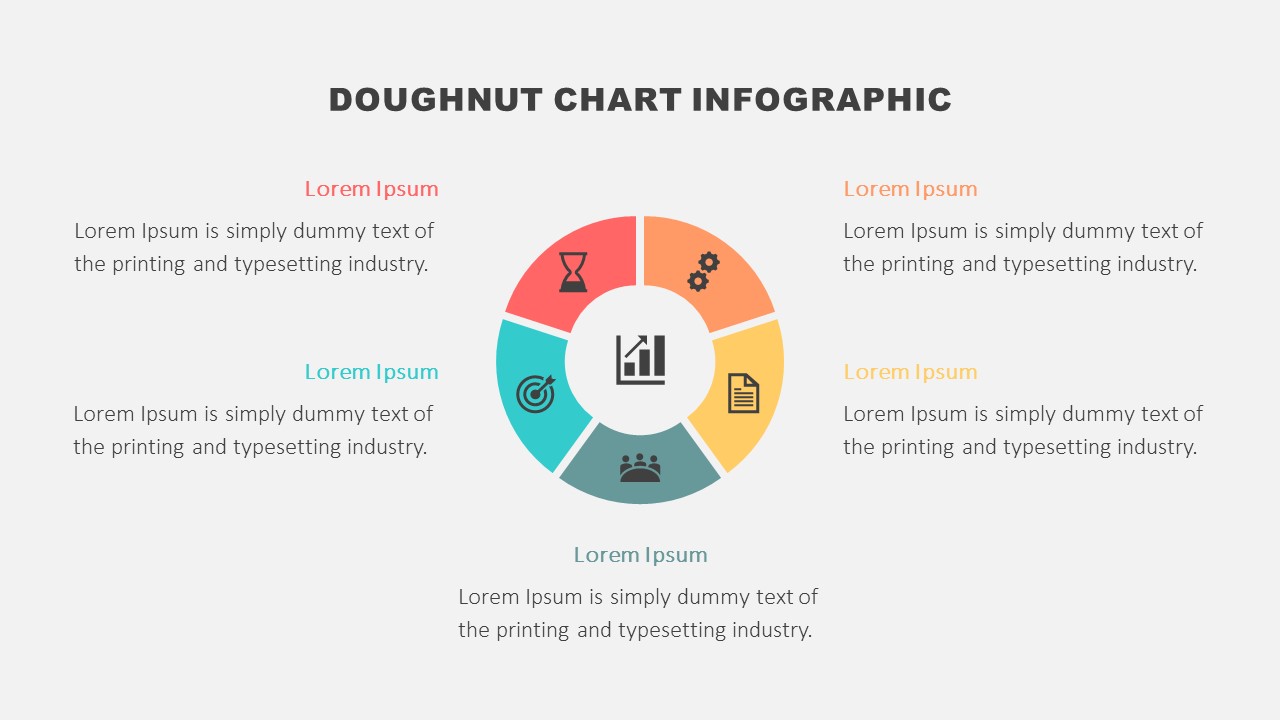
The Doughnut Chart Infographic for PowerPoint and Google Slides features a circular diagram in the shape of a doughnut chart segmented into five parts. Each segment has a distinct color to differentiate it from its adjacent segments and contains an accompanying icon to help communicate a specific step, phase, idea, or point. For each segment, you can modify icons, text, and colors as you wish. The icon in the center of the diagram can display the main concept or topic. In addition, each slide includes text boxes to insert your content.
The template comes in three different color schemes and two background layouts. Select a color scheme on the template or customize the colors for your presentation as you like.
The key features of the Doughnut Chart Infographic for PowerPoint and Google Slides are:
- Fully editable. All the design elements of the template are easy to modify.
- A choice of three different professional color schemes. Remember you can also apply colors that align with your brand standards.
- Two background color versions. The background is designed in both light and dark color versions.
- Use in Google Slides or Microsoft PowerPoint depending upon your needs or project requirements.
- 16:9 widescreen aspect ratio. You can easily change the aspect ratio to 4:3 with one click, just make sure to later fix any changes that may happen to the elements of the slide.
- Fonts used: Arial Black, Calibri Light. Keep the current fonts or pick new ones for your presentation.